Introduction:

Downtown San Antonio from the Tower of the Americas by Carol Highsmith, 2005 (LOC)
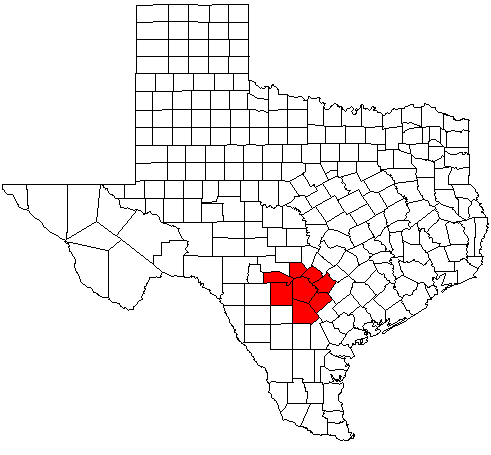
Map of Texas highlighting the San Antonio Metropolitan Statistical Area; created with the GIMP; made by User:Acntx.
Economic Base Analysis:
Workers in the San Antonio-New Braunfels Metropolitan Statistical Area had an average (mean) hourly wage of $21.03 in May 2015, about 9 percent below the nationwide average of $23.23, according to the U.S. Bureau of Labor Statistics. Regional Commissioner Stanley W. Suchman noted that, after testing for statistical significance, wages in the local area were lower than their respective national averages in 15 of the 22 major occupational groups, including personal care and service; construction and extraction; and legal. No major occupational group in the local area had wages that were measurably higher than their respective national averages. When compared to the nationwide distribution, San Antonio employment was more highly concentrated in 5 of the 22 occupational groups including office and administrative support; food preparation and serving related; and personal care and service. Conversely, nine groups had employment shares significantly below their national representation, including production; management; and transportation and material moving. (See table A and box note at end of release.) [2]
Figure 01. 2015 Occupational employment

Figure 02. 2010 Occupational employment

Figure 03. 2010-2015 multiplier

Figure 04. San Antonio-New Braunfels MSA population forecast [3]

1. Use the forecast Population increase rate to calculate the population increase in 2016 (next year):
2,394,156 * 8.12% = 194,405
2. Use the PER to calculate the population employment increase in 2016 (next year):
194,405 / 2.51660 = 77,249
3.Use the dynamic economic base multiplier to calculate the basic job growth in 2016 (next year):
77,249 / 5.51641 = 14,004
The San Antonio metro region had the sixth-fastest growth rate in the country among metros with a population of 1 million or more, growing by 2.2 percent, from 2,332,790 to 2,384,075 people last year. The metro area includes Bexar, Atascosa, Bandera, Comal, Guadalupe, Kendall, Medina and Wilson counties.[4]
A new analysis by Pitney Bowes Software has plotted out the growth of the country’s largest metropolitan areas for the next five years. The good news is the San Antonio/New Braunfels metro area is primed to see quite a few new households. All told, between 2012 and 2017, the number of households for the San Antonio/New Braunfels area is expected to grow by 55,017 — going from a total of 776,007 households as of 2012, to a projected 831,024 households by 2017, an increase of 7.1 percent. That projected growth has earned the San Antonio/New Braunfels metro the No. 5 spot on Pitney Bowes Software’s list of the Top 50 Major Metro Areas, as ranked by projected percentage growth. As part of the household growth analysis, Pitney Bowes Software also created a list of the Top 50 Major Metro Areas, as ranked by projected absolute growth. At an expected increase of 55,017 households, the San Antonio/New Braunfels area took the No. 8 spot. In fact, the San Antonio/New Braunfels metro area was one of several Texas areas that ranked in the top 10 on both of the Pitney Bowes Software lists. [5]
Shift-share Analysis:

Comparing with the EBA result, the employment growth in San Antonio-New Braunfels MSA from 2010 to 2015 is 115,020.
[6] [7] In my opinion, it’s always good to live in a growing city. It’s a vibrant economy, a diverse economy, so that’s something that bring me long-term comfort.
Reference:
[1] https://en.wikipedia.org/wiki/Greater_San_Antonio[2] http://www.bls.gov/regions/southwest/news-release/occupationalemploymentandwages_sanantonio.htm
[3] http://www.sanantonioedf.com/living/demographics/
[4] http://www.expressnews.com/news/local/article/San-Antonio-area-is-No-6-in-population-growth-in-7030115.php
[5] http://www.veramenditx.com/tag/san-antonionew-braunfels-msa/
[6] All national employment data is from http://www.bls.gov/oes/#data
[7] All Occupational Employment Statistics of San Antonio-New Braunfels MSA is from http://www.bls.gov/oes/tables.htm
All calculation is done in Excel By Zhihuang Li (myself)